
Low-visibility workflows
Without consistent traffic data, space utilization analysis relies on isolated observations.
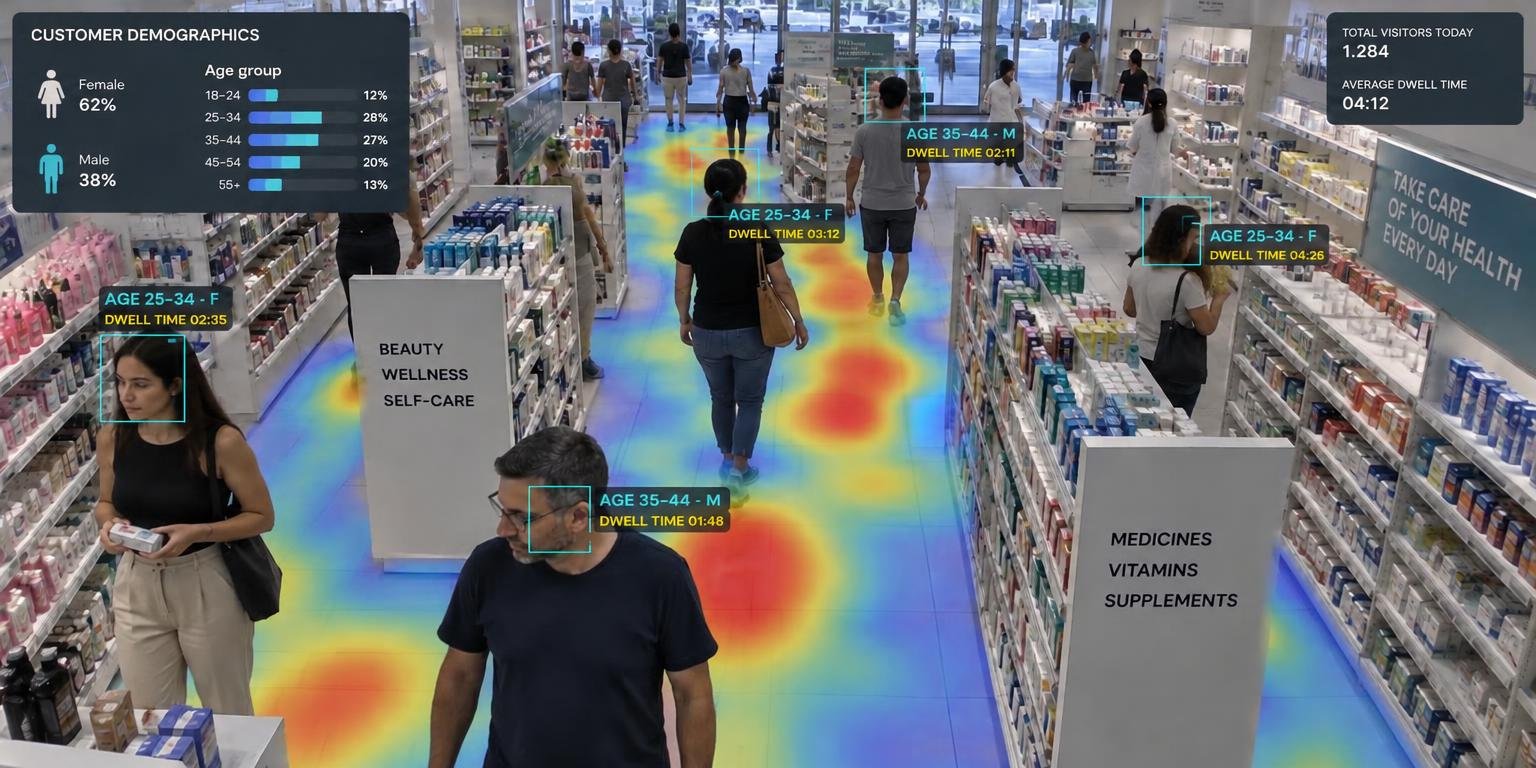
Understand your spaces. Connect indicators to operations.
Tell us about your networkWe turn flow, dwell time, and occupancy into actionable insights for schedules, areas, and facilities, with privacy built-in by design.
Indicators are defined based on the decisions your team needs to make.
Without consistent traffic data, space utilization analysis relies on isolated observations.
Stores and time periods with inconsistent criteria hinder indicator interpretation.
Service and management data do not always correlate with area occupancy.
We start with business questions: which areas get the most foot traffic, how flow varies throughout the day, where people dwell the longest. Then we define analysis zones and metrics, using aggregated data without identifying visitors.
Count traffic by area and period to compare schedules and facilities.
Measure dwell time across defined zones, with aggregated results.
Visualize high-traffic areas to guide layout and merchandising decisions.
Facial analysis for aggregate audience demographics, without identifying individuals.
Compare stores, time slots, and areas in consolidated views.
Indicators describe the use of spaces. The relationship with sales depends on cross-referencing commercial data and is not measured by cameras alone.
Adjust service schedules to match peak traffic.
Review aisle layout based on heatmap data.
Compare traffic and dwell time across chain stores.
Understand demographics by period without identifying individuals.
Illustrative examples. Indicators and analysis areas are defined for each network.
Aggregated data can feed BI platforms and reports already used by operations, depending on available interfaces.
We understand the goals, processes, and existing systems.
We define the solution, integrations, and infrastructure requirements.
We configure, customize, and connect the features planned for the project.
We test the solution in the live environment and guide teams.
We monitor operations according to the contracted scope and identify improvements.
Tell us which decisions you want to drive with data. We will define the KPIs with your team.